Marketing predictions for 2026

Marketing predictions for 2026
We’ve been keeping our eye on the crystal ball and we’ve got some thoughts on what’s going to be bi…
Read article

Looking to make the most out of your reports? Our Search Marketing expert, Neil Hannam, has created the guide for you.
For as long as advertising has existed, the need to report results has been there too. The emergence of digital channels has seen the reporting need grow significantly. We have a wealth of data at our fingertips and the ability to track most online behaviour, and with this comes the temptation to try and show as much as possible rather than illustrate what is valuable.
Much like the scientists of Jurassic Park, we as digital marketers became so “preoccupied with whether we could, we didn’t stop to think if we should.”

What that has led us to is bloated reports; often, stakeholders don’t have the time, inclination or the knowledge to read and understand these. So, in this post we’ve set out some guidelines for producing effective reports for clients or internal stakeholders.
Data are just summaries of thousands of stories – tell a few of those stories to help make the data meaningful.
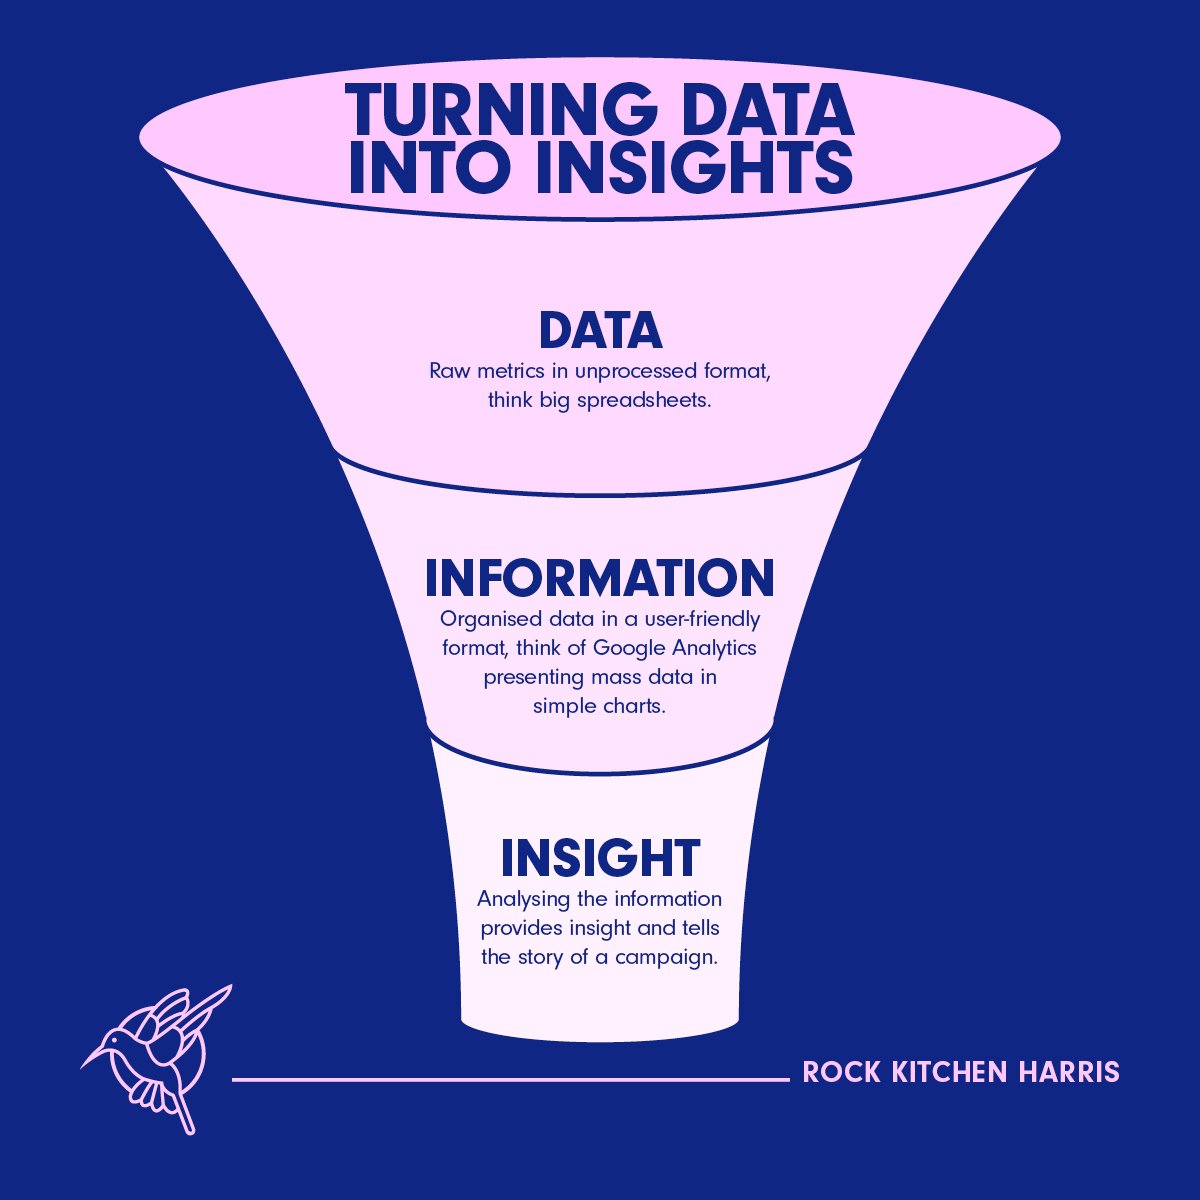
Before we begin to explore what makes a good report, we need to understand the difference between data, information and insights.
Data
Data is the raw metrics displayed in an unprocessed format. Think sizeable spreadsheets full of numbers.
Information
Information is data that is organised into a more user-friendly format that offers greater context. A platform like Google Analytics processes raw data and displays information.
Insights
Insights are generated by analysing the information and drawing conclusions. It’s the insights that tell the story - they should be the focus of your reporting.
Most marketing produces some form of data that quantifies different aspects of the activity. Digital platforms such as Google Analytics do the heavy lifting of converting the data into information and making it easier to understand.
The number of users who visit your site is a simple piece of data. Google Analytics takes that data and transforms it into information. Displaying this in a table and alongside other metrics and dimensions gives that data greater meaning and context.
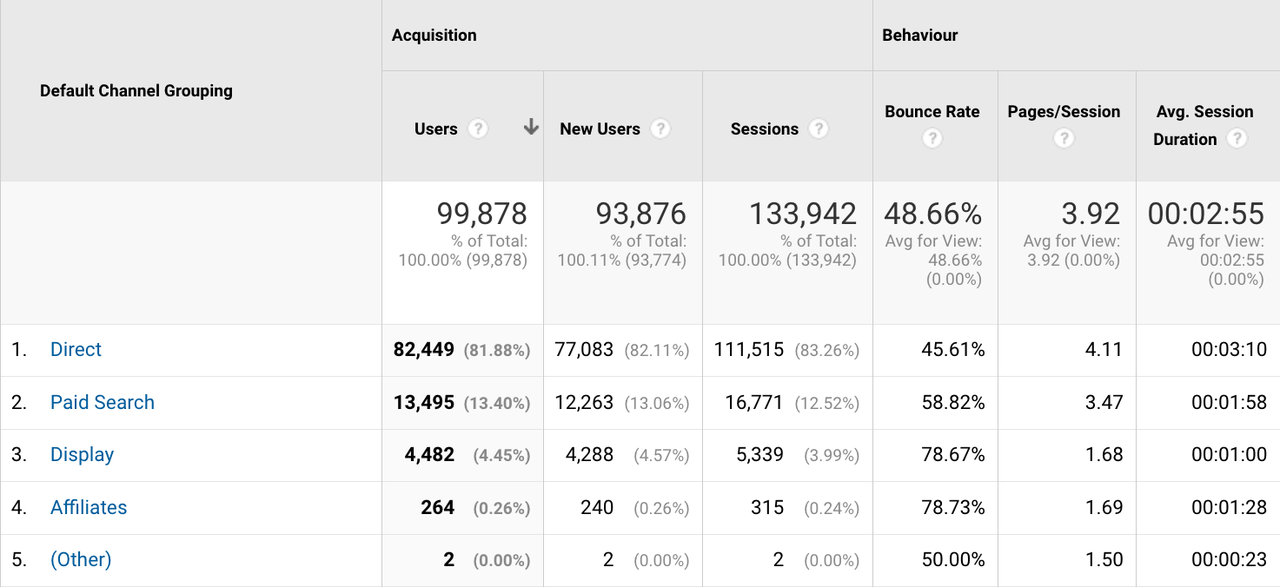
Or by processing that one metric to display in a visual timeline format gives extra context. This is where these platforms excel, converting data into digestible information.
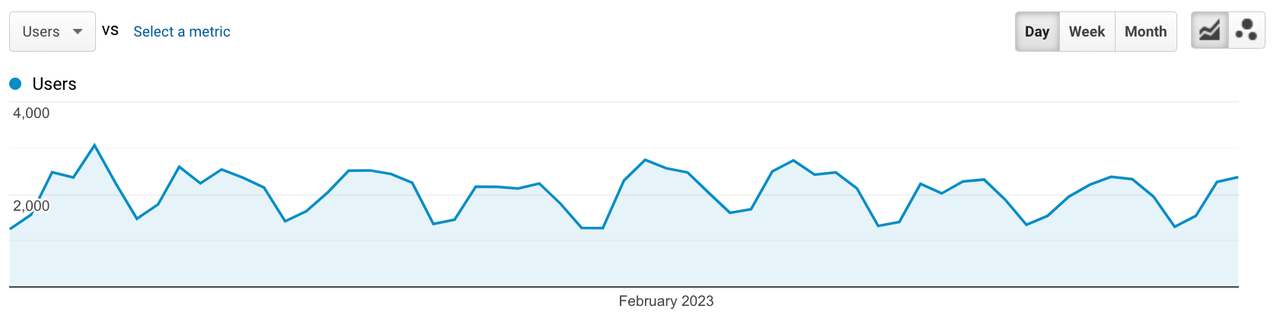
This same pattern of converting data to information occurs across most digital marketing platforms. The issue is that too often this is as far as reporting goes; information gets replicated and displayed in reporting tools, but we omit the vital step of converting that information into insights.
It’s understandable why this happens. Ask a stakeholder what they want to include in reports and often the answer is that they “aren’t sure”. They may be able to offer you a few metrics they’d like to see but that can often be the extent of their input.
It can also be the case that stakeholders defer to the marketer's judgement as they don’t have the same depth of knowledge. With little to no direction there's a temptation to include as much information as possible.
But more information does not lead to more insights without analysis. It’s unreasonable to expect that more information will enable stakeholders to develop their own insights.
So, how do we address this?
Before committing to creating any kind of report, you need to define the requirements. Each type of report will be different and needs careful consideration, there is no ‘one size fits all’ approach. This needs to be a collaborative process between those producing the report and those who’ll be in receipt of the report.
Reports should tell a story with your data that ties into business objectives.
Your marketing should be planned and executed in line with the business objectives. It makes sense then, that your reporting, and in particular the insights, should tie back to these objectives. If goals, objectives or KPIs do not exist, then your reporting is lacking a clear focal point and this needs to be addressed first.
As marketers, we need to remember that stakeholders may not value the same things we do, and they may not be aware that information they value is available to them. From stakeholders we need to understand;
And your stakeholders may need to understand from marketers;
Defining the reporting requirements will save significant amounts of time and frustration in the long run.
The beauty of a lot of digital marketing reports is how easy it is to automate the gathering of the information. With tools such as Google Looker Studio (formerly Google Data Studio) you can pull live data from a wide array of analytics platforms.
These include Google products like Analytics, Google Ads, YouTube Analytics and Google Sheets. With additional software you can import data from third party applications, too. These include social pages, social ads, third-party marketing tools and even CRM platforms such as Salesforce.
It takes some time to learn and configure but it will save you time in the long run; Looker Studio helpfully provides ready-made templates you can use as a basis. There are also a lot of community made templates available for free or a modest fee. The more you automate the process of gathering and displaying the data, the more time you can then dedicate to providing insights.
Reporting frequency will again be dependent on the type of marketing activity and the stakeholder needs. A platform like Google Looker Studio allows for up-to-date information to be available at all times in an online dashboard. However, you need a check-in point at which you add your insights.
For digital retainer clients, the natural inclination is to default to a monthly reporting schedule. This is a nice check-in point, but you need to ensure your report reflects both short-term impact and long-term direction of travel. All too often people illustrate one or the other and this means valuable context is lost.
To illustrate the long term direction of travel you may also want to forgo the standard year-on-year comparisons. Instead, consider looking at setting a benchmark against an average of the previous 12 months. This gives a consistent baseline to measure from rather than using metrics that can differ month to month.
If you’re running a shorter term campaign, you need to decide the frequency with which insights are added. You don’t want this to only come at the end of the campaign. Regular insights can inform changes to improve performance. Discuss with stakeholders how frequently these will be supplied and reviewed.
One thing we would recommend for almost any report though is a single page executive summary.
A detailed report may include everything discussed and agreed upon but will it get read in full every time? In my experience, rarely. A one page executive summary is far more likely to be though.
So first, use the initial page of the report to display the most important pieces of information. This should provide a snapshot that is clean, clear and concise. Keep it KPI-focussed and and check off the key informational needs of your stakeholders. Accompanying this information should be the most relevant and valuable insights. Again, keep them short, to the point and tied to the KPIs.
Next, a single overarching page that summarises that displays broad performance data helps set the scene. Think of it as the picture of marketing health; show each of the channels required, how these have performed, and how they contribute towards those agreed KPIs. Start broad but keep it to a single page. Your insights here will focus on general patterns and trends.
Then, the rest of the report should drill down into the information in more detail. If it’s a multi-channel report, have different pages for each channel so it’s easy to view them in isolation. This is particularly useful when there is a greater focus or spend occurring in one channel. It's likely to be the one stakeholders are most keen to review.
If you have many KPIs, consider including a separate page dedicated just to these measures of success. Again, this is likely to be a core focus when reviewing the reports, so dedicate some time to displaying and analysing this aspect.
With each piece of information you add to a report, ask yourself three questions;
Asking yourself these questions each time will help you minimise the bloat. Identify whether you’re adding it because it adds clear value for stakeholders or whether it could be omitted or shown in a more effective way.
Also consider how you label the charts, graphs and tables you choose to include. For example, labelling a chart ‘Sessions by Channel’ is not as easy to understand as ‘How do users come to your site’. Consideration for stakeholders, who may not have the same level of knowledge, can go a long way to making your reports more accessible to them.
Finally, every page should include tailored insights for the information displayed on them. Try to avoid summarising all the insights on a separate dedicated page. You should aim to display the insights alongside the information so they can be with the context in plain sight. Sometimes this might be unavoidable; if so, refer to the relevant page and information that your insight is based upon within your insights themselves.
Reporting is a complex process, and all too often they become a chore for everyone involved. Stakeholders don’t read them because they are too complicated. Marketers resent creating them. Both should see them as an opportunity to communicate the value of the marketing activity across the business.
The key to creating reports that work is understanding the purpose of the report and defining the needs of stakeholders. Without purpose and needs, reporting becomes a guessing game. Both parties need to ensure there is clarity and understanding before creating any reports.
If you’re struggling with defining your reporting needs or creating reports that work for your business, get in touch and we’ll be happy to help.
We’ve been keeping our eye on the crystal ball and we’ve got some thoughts on what’s going to be bi…

“People don’t read or watch the news anymore. They get everything from social media”Sound familiar?…

Millions of people listen to podcasts every day, so why isn't it one of the most prominent cha…