Sunsetting of Universal Analytics Announced

Sunsetting of Universal Analytics Announced
Google has announced that Google Analytics 4 (GA4) will replace Universal Analytics in July 2023. F…
Read article

Delving into the world of Google Analytics 4 (GA4) and uncover the common mistakes and hidden pitfalls that we’ve encountered whilst upgrading client accounts.
Like it or not, the move to Google Analytics 4 (GA4) is fast approaching (or if you’re reading this after 1st July 2023, it’s already here). It’s a big change for us all, the biggest since the launch of Universal Analytics (UA) back in October 2012.
Working to support clients on the transition to GA4, we understand the challenge this presents. With Universal Analytics having been around for more than a decade, the platform has become second nature to people; there’s a high degree of understanding around how it works and how to find the data that matters to you. With GA4 we’re all starting from scratch again.
Even if you haven’t yet switched over to using GA4, you should at least have a property set up that is processing data. If not, please stop reading this and go and set that up right away. If you do have a property set up and are still getting your head around things, we’ve put together a list of common hurdles and issues we’ve discovered that might help you in adjusting to the new analytics world.
If you’ve not yet set up a GA4 property, it is likely that Google will have now created one for you. Putting trust in Google to automatically replicate your existing UA property tracking and goal/conversion set up is risky. Even if you do entrust it to do this, it’s of vital importance that this is reviewed and checked to ensure it is delivering the data you need.
For those that have already set up a GA4 property, you need to connect it to your existing UA property. If you see the message below when logging in to your GA4 property you need to select and connect to the relevant UA property.
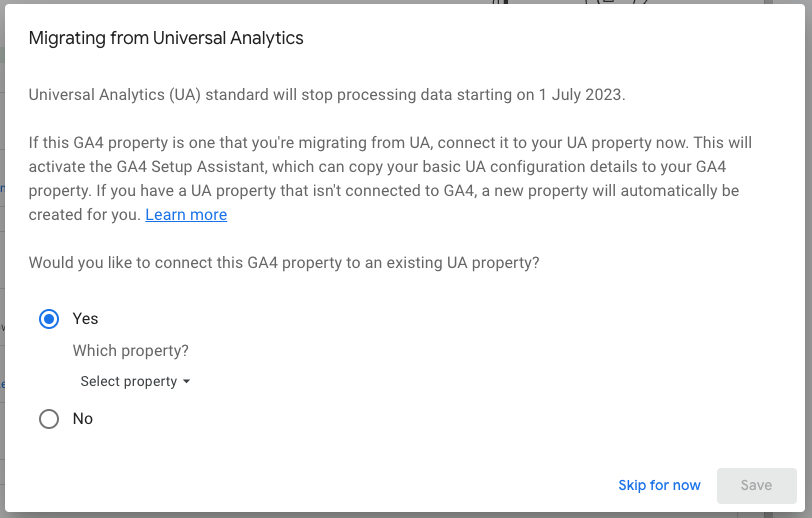
Google won’t recognise that you have migrated to GA4 until you do this. You then risk Google auto-migrating you with a new GA4 property it has created for you unless you opt out. It’s tempting to ‘Skip for now’ but putting it off is only increasing the likelihood of Google stepping in and doing it for you.
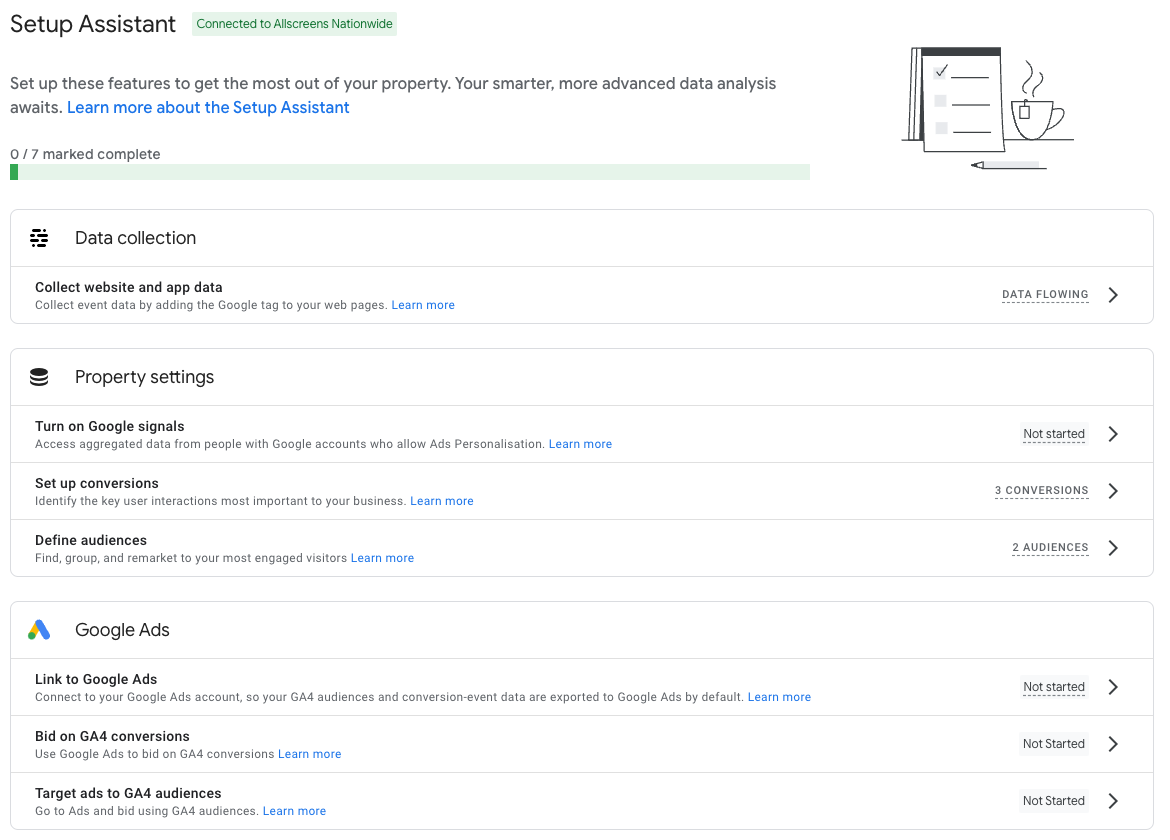
To avoid this, not only do you need to connect your GA4 property to your UA property, you need to ensure you’ve checked off all the steps in the GA4 Setup Assistant (unless you’ve opted out of auto-migration).
These seven steps are a crucial part of the set up. However, completing them does not automatically mark them as done; you have to go in and check them off manually. If you don’t, it leaves the door open for Google to come in and take care of things you’ve not checked off, even if you have actually completed them.
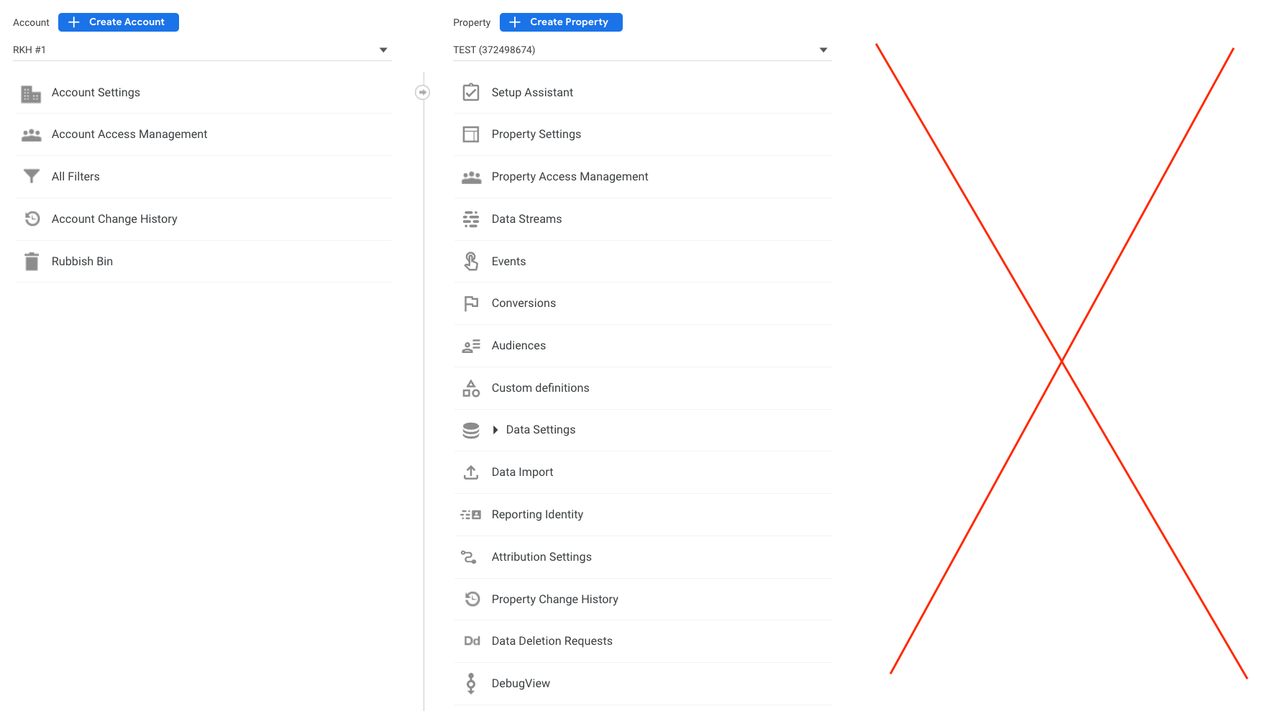
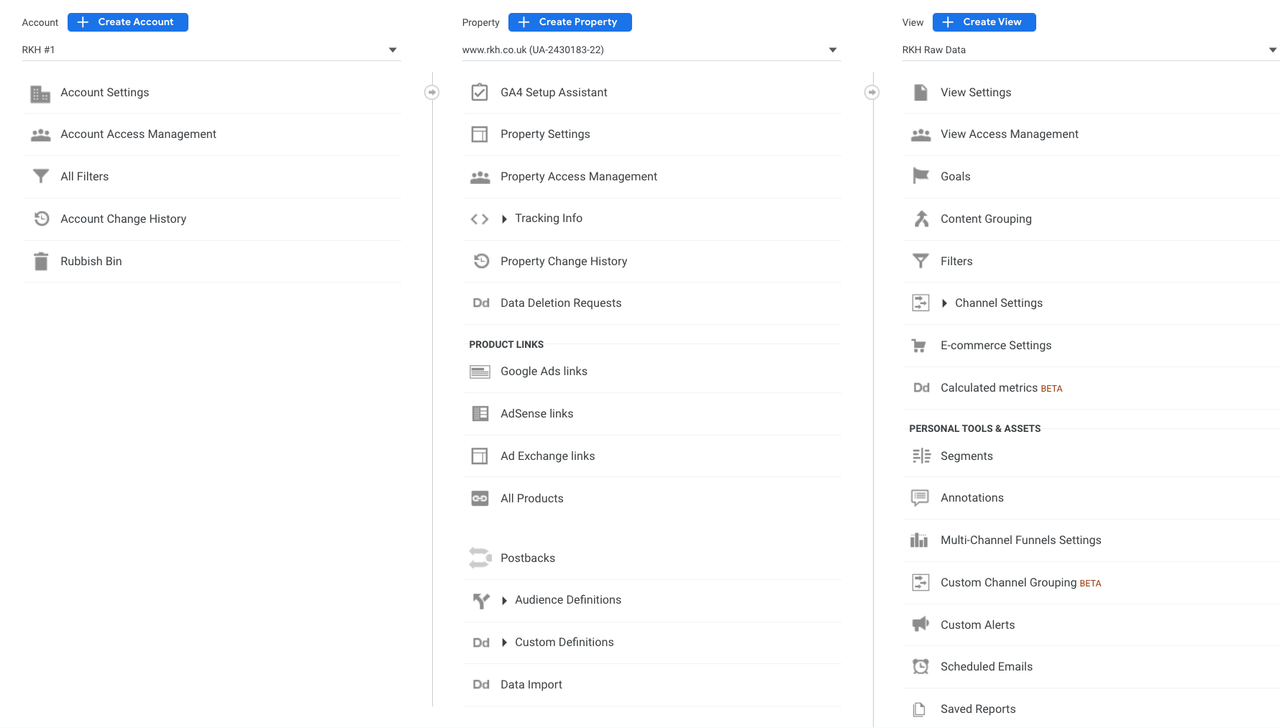
Unlike Universal Analytics, GA4 properties do not allow for multiple Views. Users should be accustomed to having multiple Views created, so this is a significant change.
Usually this takes the form of:
This isn’t currently possible with GA4, and so filtering internal traffic is done within the single property.
You do still have the ability to filter data and there is a method for filter internal traffic. It’s built into GA4 but it’s not immediately obvious or easy to locate. Follow the step-by-step instructions from Google to locate it. The process is far more involved than the simple filter you’d set up for a new View in the older version of Analytics - it requires you to identify internal traffic first and then create a data filter to remove it.
This is a common occurrence with GA4. Things that were quick and straightforward to set up in the older UA version are now much more complicated to achieve. We can only hope this improves with time, but at the moment, for the average user, this does seem to be a serious barrier to overcome.
It’s also important to note that if you do create a filter that excludes data, this data will never be processed and it won’t be available to view in GA4.
With GA4 being a brand new platform it's no surprise that even some of the names of metrics and dimensions we're all used to have now subtly changed or mean something slightly different. There are also some new metrics to get your head around, too many to go through here.
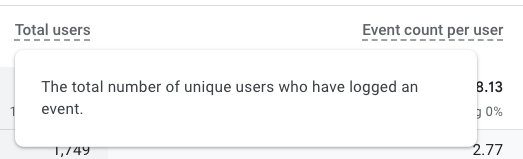
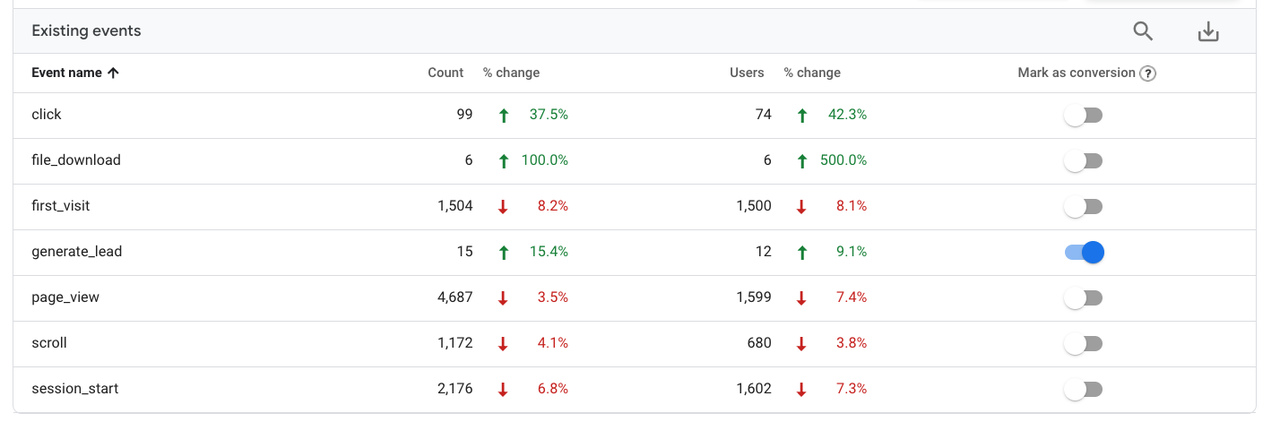
But one subtle change we have have seen stump a few people so far is the use of Users in some reports and Total Users in other reports. In nearly all the default reports the preferred metric GA4 displays is Users. Only in the Events and Conversions reports does it seem to display Total Users.
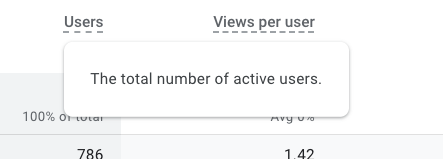
This is a subtle but important difference. As you can see, the numbers are slightly different indicating they are reporting slightly different things but the labels don't really help, especially the inclusion of the word 'total' in the description of Users. In short;
An engaged session is any session that lasts longer than 10 seconds, where two or more pages were viewed, the user scrolled to the bottom of the page or at least one conversion event was triggered.
Why the Events and Conversions reports display Total Users and every other report displays Users is a bit of a mystery at this point. But, it is important to understand the difference between the two and more importantly how GA4 is classifying Users given the prominence it has in many reports and how it may affect other metrics that are calculated using the Users data.
Another thing that is now a little more complicated is the creation of goals, or ‘Conversions’ as they are now called in GA4.
Gone are the simple template goals and built in types that most will be used to, which could be set up in less than a minute. Even more complicated event-based goals still being quick to configure using Google Tag Manager.
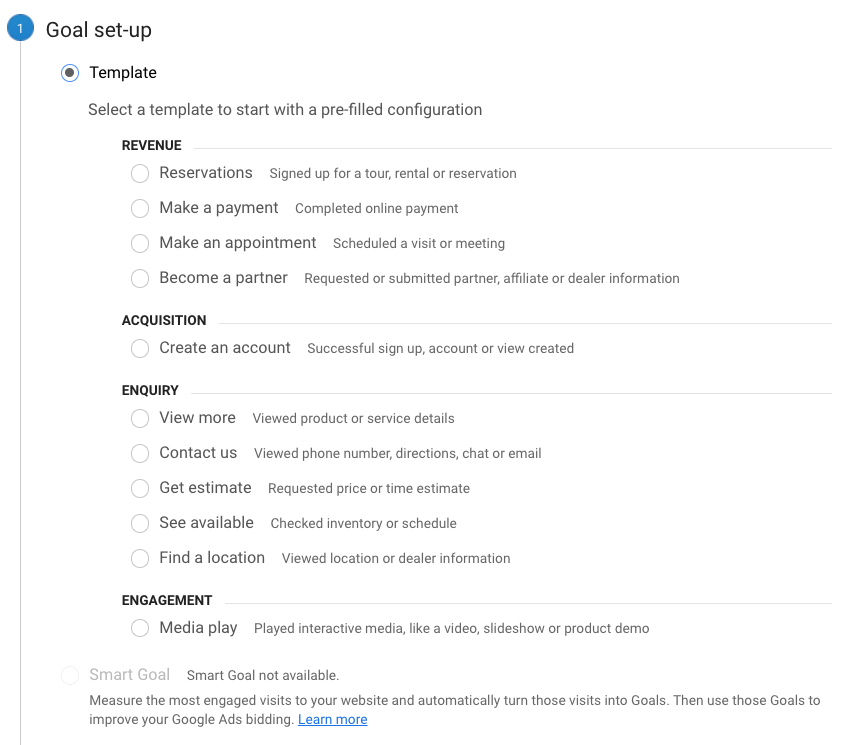
In their place are conversions. Some are simple to set up and some can be imported from a connected UA account, but to the less experienced Google Analytics user, setting these up is likely to be far more challenging.
As GA4 is event-based, every conversion action you wish to track requires an event to be measured. Events like page views are built into GA4, so tracking the view of a ‘thank you’ page is still a simple process; you create a new event and configure the parameters required to register that successful event as you can see in the example below.
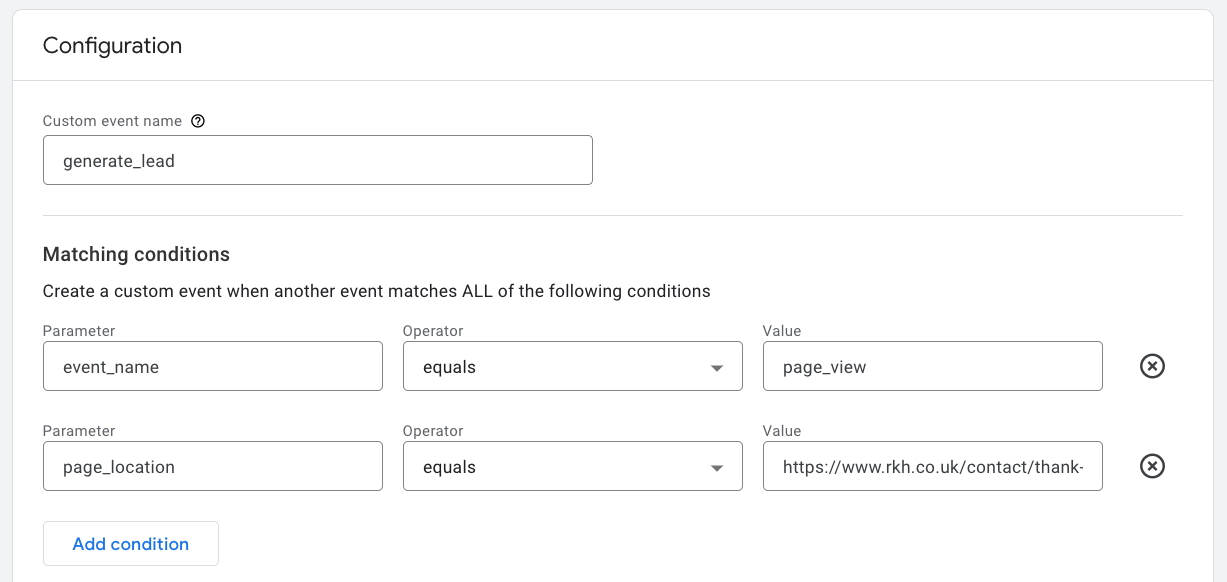
Then all you need to do is flick the slider to instruct GA4 to record that event as a conversion and it’ll start to show in your reports.
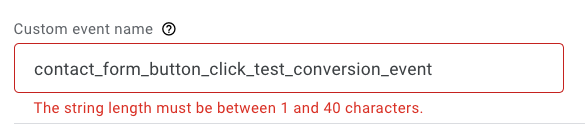
Speaking of events and conversions, it’s important to be aware that event names have a 40 character limit. This is especially important if the event in question will then be used to register a conversion.
For an event to register as a conversion, Google appends the _c parameter to the end of the event name to mark it as a conversion event. It is this additional element that makes the event show in the conversions report. If your event name exceeds the character limit, this parameter can not be added. It will still register as an event, just not as a conversion.
If you’re creating a new event within GA4 and you exceed this, GA4 will display a warning if you exceed this limit and stop the event from being saved.
However, if you’re setting up a GA4 event in Google Tag Manager then no warning is shown if you exceed this limit.
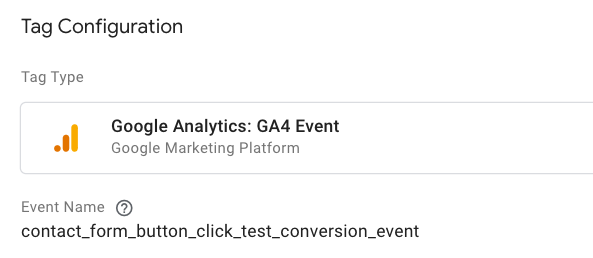
What then happens is in the event report, you’ll see your event but the name will have been truncated to the maximum of 40 characters.
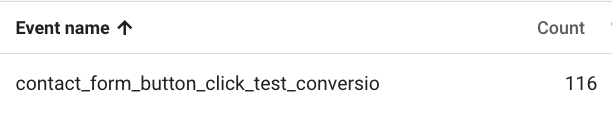
But in your conversions report, the event name will be displayed but no conversion events will be displayed because Google can’t add the parameter to mark it as a conversion.
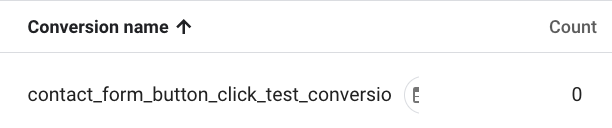
We’ve already come across one instance where the point the event name was truncated just so happens to the end of a word. In that example it wasn’t as immediately obvious that the event name was too long.
GA4 can use multiple methods of data collection, not just the data collected through the normal implementation of a tracking tag. One of these extra data collection methods is Google Signals; when activated, this data collection method gathers additional information from users logged into a Google account who have consented to Ad Personalisation.
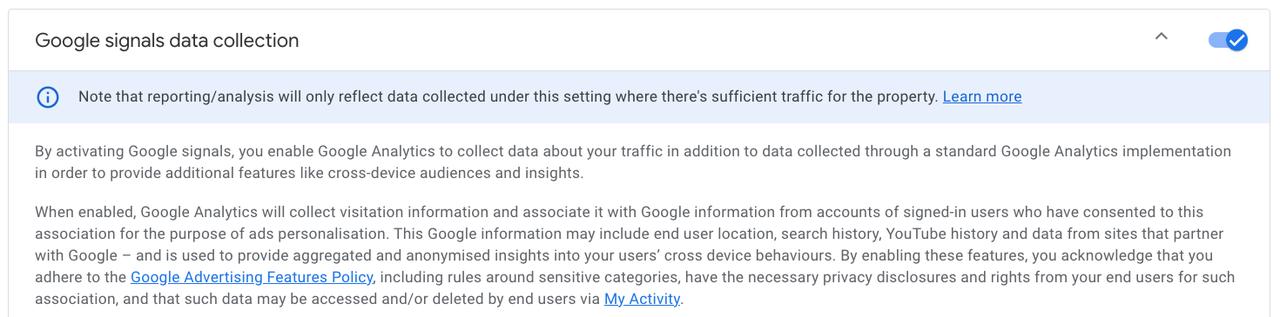
Now, given that turning on Google Signals is one of the seven steps required to complete the set up (more on that here) then it’s likely most people will be enabling this.
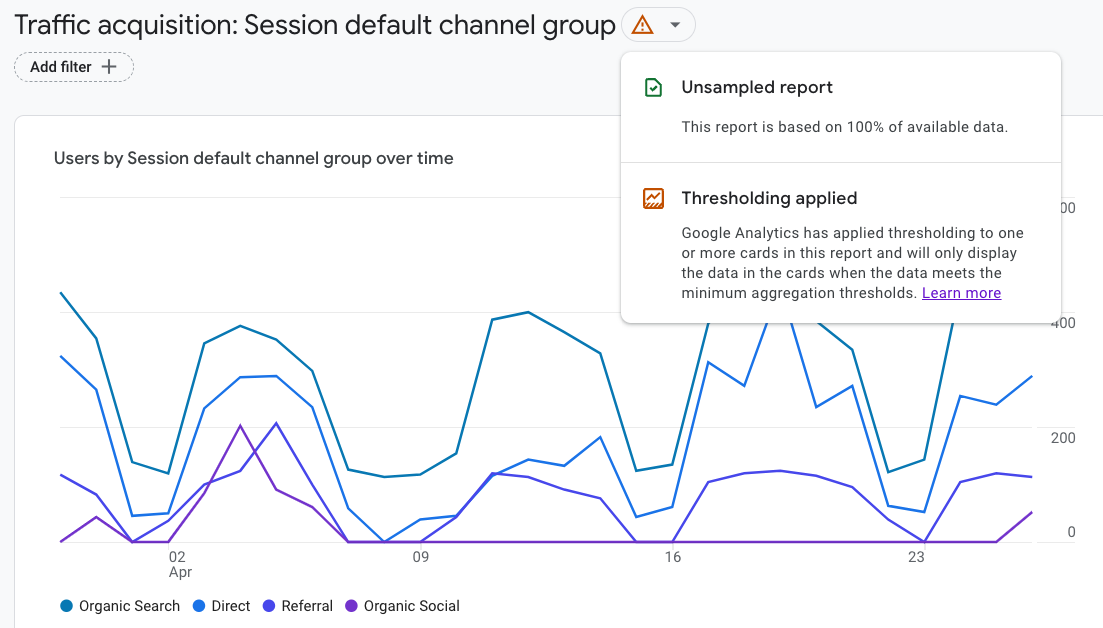
In doing so, you run the risk of Google applying Data Thresholds to some of your reports. If you’ve a low volume of user data in the time window, GA4 will hide some of that data in your reports. For example, on the Page and Screens report, we've found data thresholds will mean any pages with less than around 40 views will not be displayed. This data is being gathered and processed but it won’t be displayed unless it hits the threshold required.
There are other reasons that your data might have these thresholds applied, and you can see a more detailed explanation from Google on each of those here.
You’ll know if a report has thresholding applied by the triangular orange warning sign next to the report name at the top of the page.
This issue is one we’ve stumbled across but yet to find a clear explanation for. For most clients, we use Google Looker Studio to create reporting dashboards or monthly/campaign reports. You'd think that the data you see in the GA4 interface would match the data displayed in a Looker Studio report. But that is not always the case.
We’ve come across many occasions where there is a disparity between the data. For example, take these simple sessions by default channel grouping reports for March; the session numbers in GA4 and the export to Looker Studio match each other, but the user numbers differ on all but the Unassigned channel.
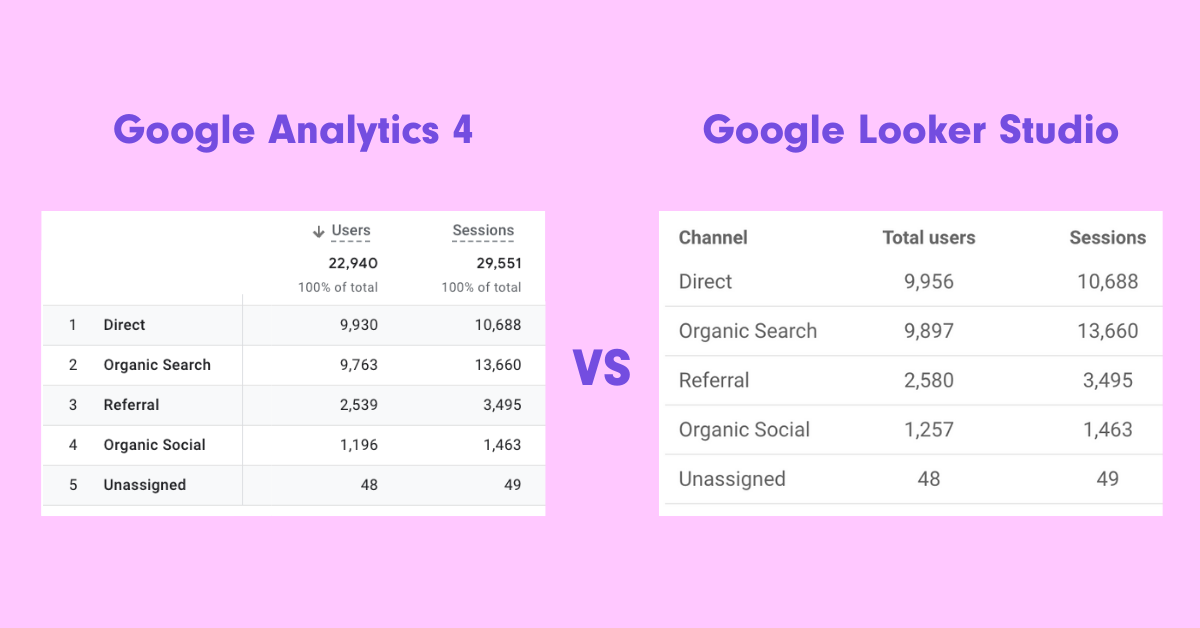
The data in GA4 is indicating thresholding is being applied to the data (see more on that above). But exporting that data via the API shouldn’t bypass those thresholds. We’ve done some digging and can’t find a definitive explanation for this but we’re not the only ones to have seen it and pondered why.
The only conclusion we can draw is that the data we can export via the API is different from what GA4 is electing to show. We expect this to confuse users that use both GA4 and Looker Studio for reporting, and we expect plenty of questions to arise around which set of data is ‘right’.
Quota limits are another issue we’ve found ourselves explaining to clients who are exporting GA4 data into Looker Studio. Data is imported into Looker Studio from GA4 via the Google Analytics Data API.
With GA4, Google has imposed a limit on the number of requests you can make in a set period. These requests are called tokens and you only get so many per hour and per day before your report starts showing the below error message.
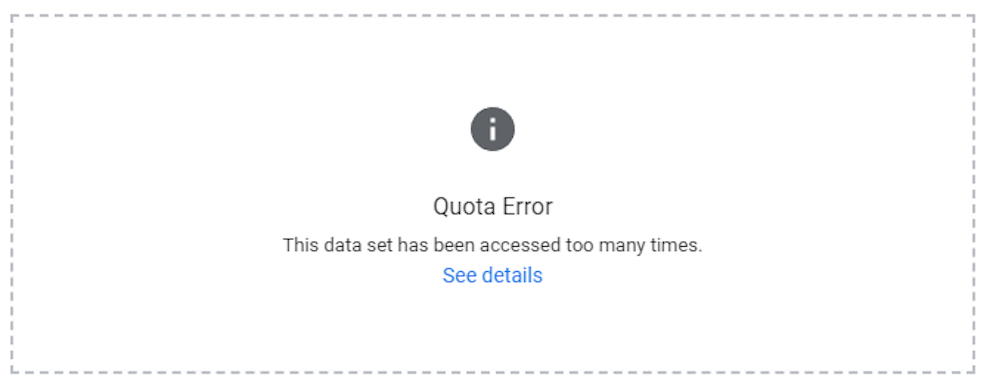
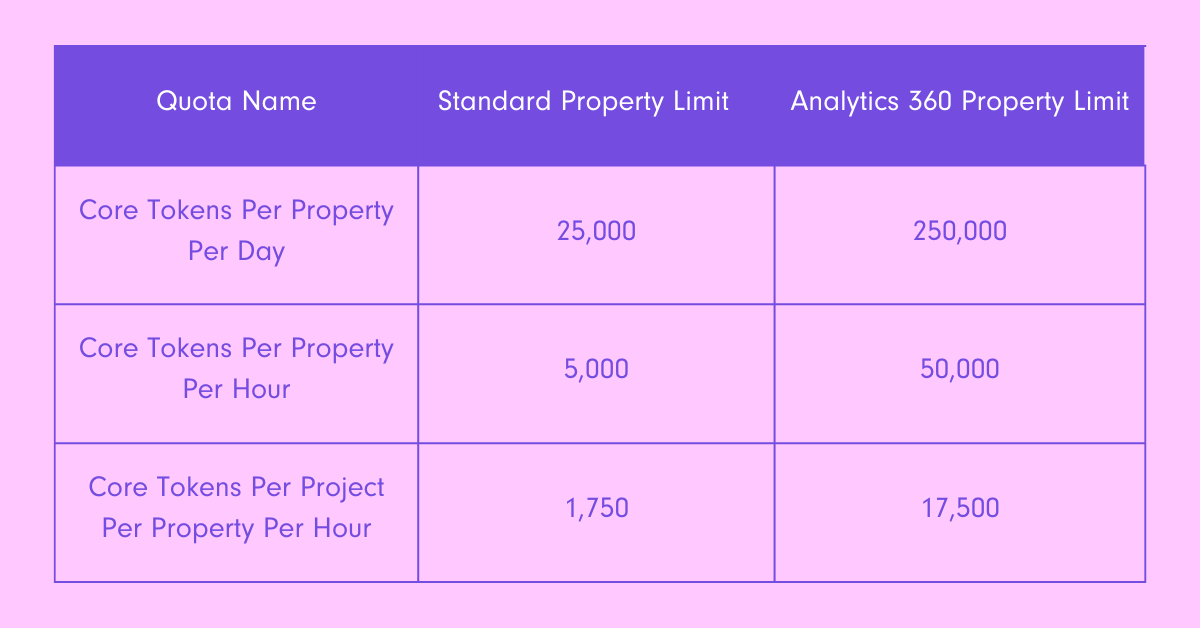
Each element of your report in Looker Studio will utilise a different number of tokens; below are the quotas most GA4 properties have available to them.
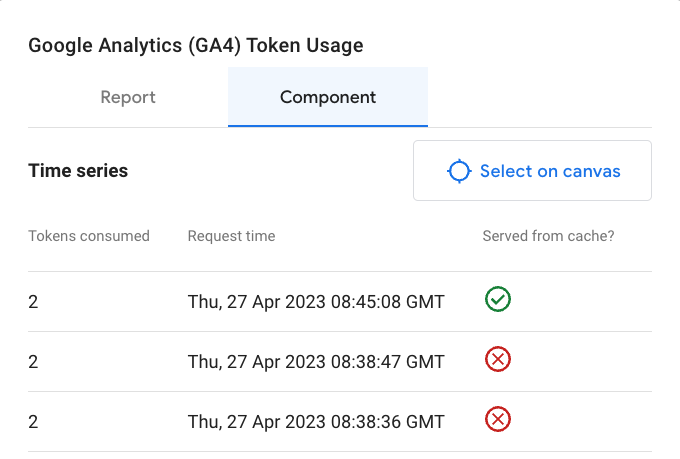
So, how do you know how many tokens you are using? In edit mode, right click any chart or data element and then select ‘Google Analytics token usage’ from the pop-up menu. You’ll then see a breakdown of token usage and you can flick between your selected component or the whole report.
So, how do you know how many tokens you are using? In edit mode, right click any chart or data element and then select ‘Google Analytics token usage’ from the pop-up menu. You’ll then see a breakdown of token usage and you can flick between your selected component or the whole report.
Google has produced a troubleshooting guide to help users reduce the likelihood of exceeding these limits. The easiest way to reduce the chances of this occurring is to be laser-focussed on what you choose to include in your Looker Studio reports - when doing this, try to be ruthless and cut high-usage elements that you don’t need. It might help to take a look at our article on Creating Value With Your Reporting for ideas on how to approach and streamline your reporting.
Google Analytics 4 is a big change and something that’s going to take a fair bit of getting used to. It’s going to be a steep learning curve, especially if you’re not an advanced Google Analytics user, but there are plenty of guides, courses and online tutorials out there to help you learn.
If you’ve not yet set up your GA4 property or you’re struggling to configure your property to deliver the information you need, then get in touch with us today and we’d be happy to help.
Google has announced that Google Analytics 4 (GA4) will replace Universal Analytics in July 2023. F…

Google's Search Generative AI is a huge change for the search engine as we know it, and for br…

It’s been a couple of weeks since Google announced the new Search Generative Experience (SGE) at it…
Get in touch with us today.